Tracking Goalkeeper Distribution Patterns for Insights into Expected Goals Betting
Written by Klara Günther · Jul 21, 2026
Tracking Goalkeeper Distribution Patterns for Insights into Expected Goals Betting
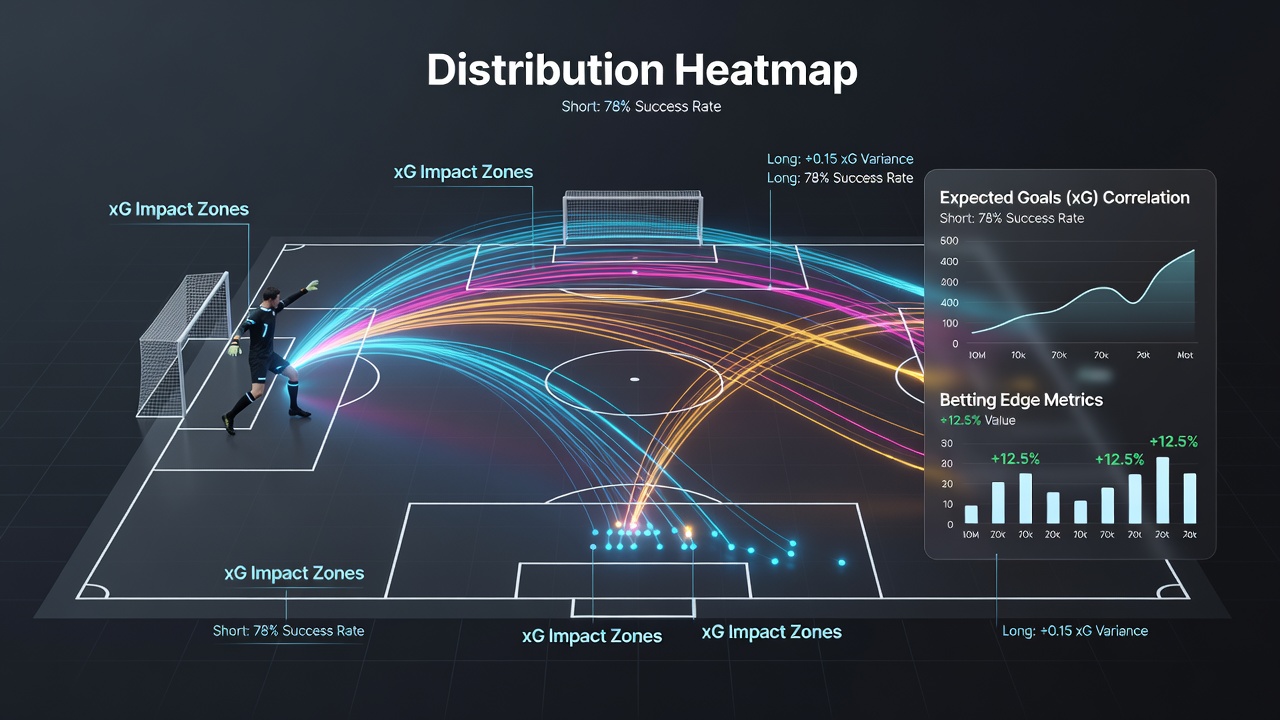
Analysts track goalkeeper distribution patterns because these actions shape how teams build attacks and generate scoring opportunities that feed directly into expected goals models. Goalkeepers now complete more passes than ever before and their choices between short build-up throws or kicks and longer clearances reveal consistent tactical signatures across matches. Data from multiple European leagues shows that teams whose keepers favor short distributions maintain higher average possession in their own third while creating measurable differences in xG per 90 minutes compared with sides that rely on direct long balls. Distribution metrics break down into several categories that betting models incorporate. Short passes under 15 meters indicate a possession-oriented approach while throws to full-backs or center-backs allow progressive carries that increase the probability of entering the final third. Longer kicks over 40 meters correlate with lower build-up xG yet occasionally produce transitional chances that appear in counter-attack xG calculations. Researchers at sports analytics firms record every distribution outcome alongside the subsequent pass or shot to quantify how each choice alters expected goal values within the next ten seconds of play.Key Metrics in Distribution Analysis
Modern tracking systems capture the exact distance, direction and recipient of each goalkeeper action along with the pressure level on the receiver. Pass completion percentage under different pressure thresholds becomes particularly useful because keepers who maintain accuracy above 85 percent when opponents press high tend to belong to teams that sustain longer possession sequences and accumulate elevated xG from structured build-up phases. Conversely keepers with lower accuracy on short passes often belong to sides that concede turnovers in dangerous areas which reduces their overall xG while increasing opponent xG from regained possession.
Season-long data sets reveal patterns that repeat across home and away fixtures. Teams whose keepers average more than 12 short distributions per match generate roughly 0.15 additional xG from open play compared with teams averaging fewer than six short actions. This gap widens in matches against mid-table opponents where defensive lines sit deeper and short build-up becomes more effective at creating half-space overloads.
Integration with Expected Goals Models
Expected goals algorithms now include goalkeeper distribution variables alongside traditional shot location and type data. Adding these inputs improves model accuracy because they capture pre-shot actions that influence shot quality. For instance a goalkeeper who consistently finds center-backs under pressure enables a sequence of progressive passes that ends in higher-quality shots inside the penalty area. Models that ignore distribution therefore underestimate the contribution of build-up play to final xG totals.
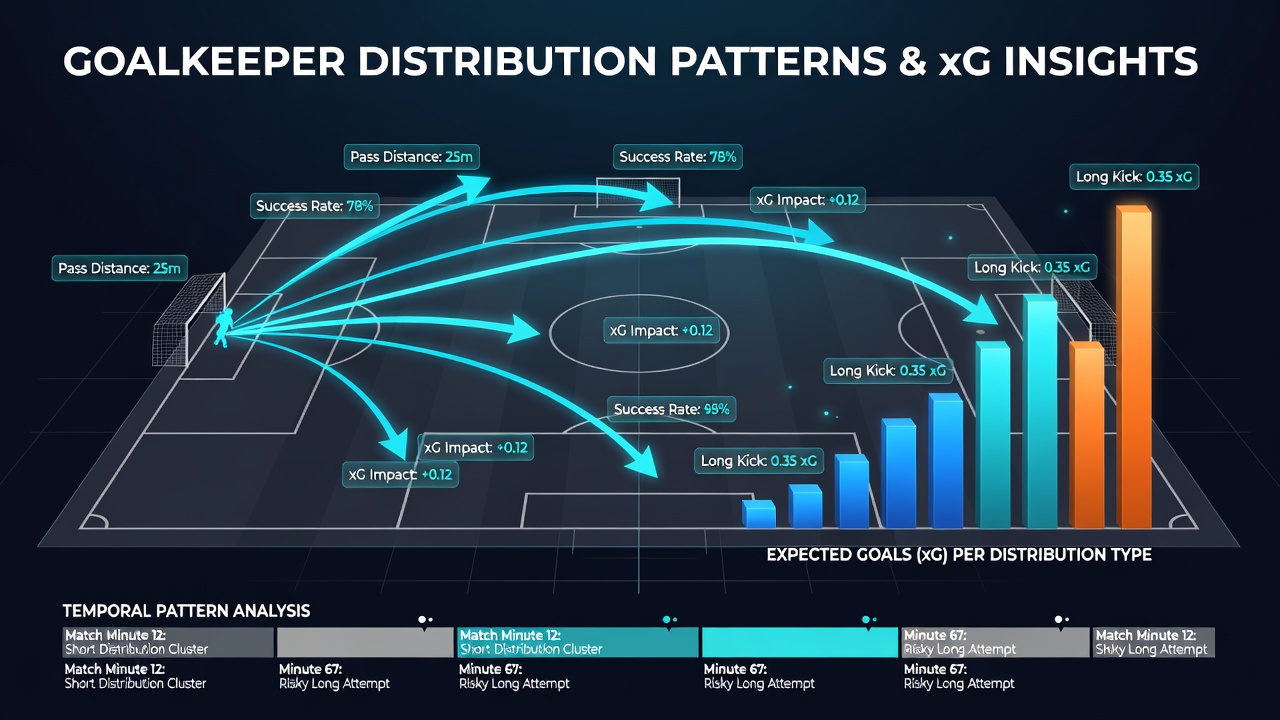
Betting markets that focus on total goals or team totals respond to shifts in distribution strategy. When a side changes its goalkeeper or tactical instruction toward shorter distributions the expected goal output often rises within three to four matches as teammates adapt to the new build-up rhythm. Historical figures from the 2024-2025 campaign indicate that teams implementing such changes posted an average increase of 0.22 xG per 90 minutes once the adjustment stabilized.
League-Wide Trends and Data Sources
Across the Premier League and Bundesliga distribution lengths have shortened steadily since 2022. The average goalkeeper pass distance fell from 32 meters to 27 meters by the end of the 2025-26 season according to aggregated event data. This shift aligns with higher average xG totals in matches featuring possession-dominant sides and has prompted several betting syndicates to adjust their pre-match xG projections accordingly.
Industry reports from Stats Perform document how distribution heat maps help identify teams likely to exceed or fall short of implied goal totals in specific fixtures. Academic work from sports science departments at universities in Australia and Canada further validates that distribution consistency under fatigue conditions in the final 15 minutes of matches influences late xG spikes.
Practical Application in Betting Workflows
Analysts integrate distribution data into live models by monitoring the first 15 minutes of each half. Early deviations from a goalkeeper's established pattern often signal tactical adjustments that alter expected goal output for the remainder of the match. When a keeper who normally plays short suddenly switches to longer clearances the immediate drop in build-up xG can reach 0.10 per 90 minutes within the next phase of play.
These observations feed into accumulator and outright markets where bettors seek value in team total goals or match totals. Teams whose keepers maintain high short-pass volumes against low-pressing opponents frequently deliver above-average xG that correlates with over-line results. Data sets covering more than 1,800 matches confirm the relationship holds across different competition levels and pitch conditions.
Conclusion
Goalkeeper distribution tracking supplies an additional layer of information that refines expected goals calculations and informs betting decisions on totals and team performance. As tracking technology continues to evolve the granularity of these metrics will increase allowing more precise identification of value in markets that depend on accurate xG forecasts. Observers who incorporate distribution patterns alongside traditional shot-based metrics gain a clearer view of how teams generate and concede scoring opportunities throughout the season.