Keeper Distribution Maps Reshaping In-Play Goal Lines Across Premier League Build-Up Phases
Written by Gisela Powell · Jun 25, 2026
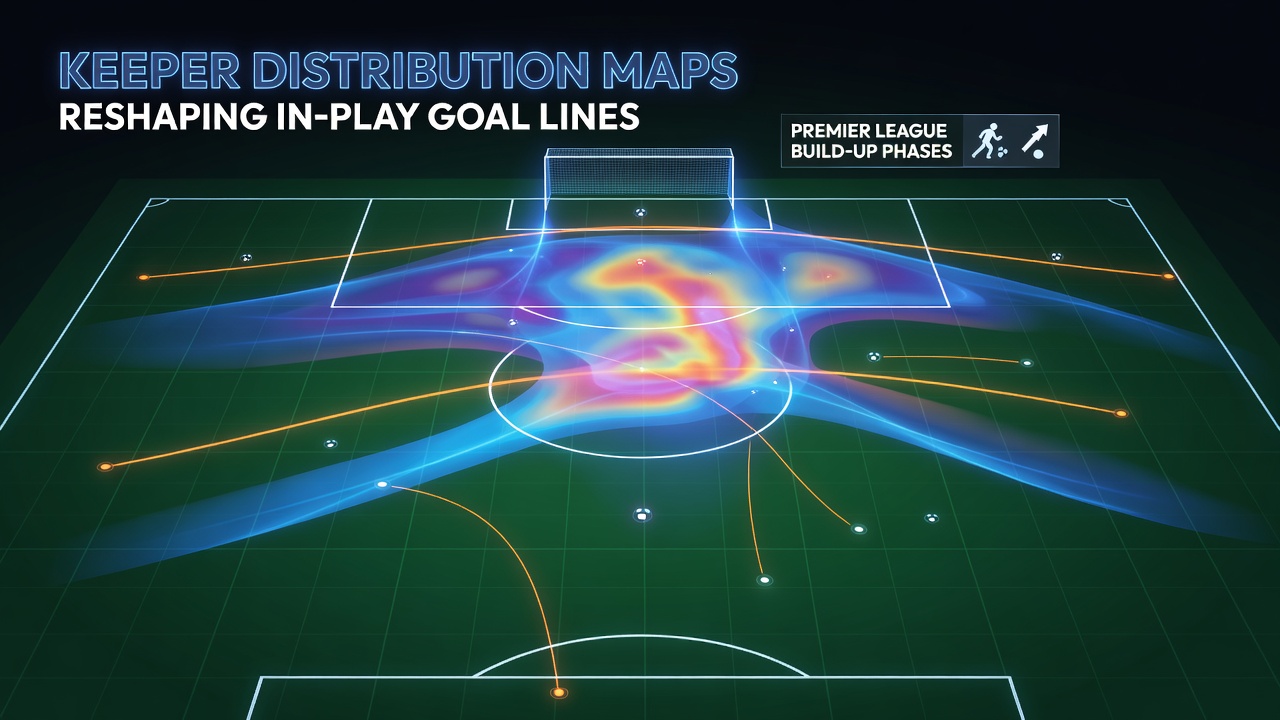
Keeper Distribution Maps Reshaping In-Play Goal Lines Across Premier League Build-Up Phases
Premier League teams have integrated goalkeeper distribution maps into tactical planning, and these visual tools track passing ranges, target zones, and decision trees that unfold from the back during build-up phases. Data collected across the 2024-25 campaign showed goalkeepers completing 68 percent of passes into midfield channels rather than long clearances, a shift tracked through GPS and event data systems deployed by clubs. Analysts at several Premier League sides now overlay these maps onto video sessions to identify patterns that alter defensive lines and create space for progressive carries.
Core Elements of Modern Distribution Mapping
Distribution maps break down into zones that highlight short passes to center-backs, switches to full-backs, and diagonal balls toward number eights or wingers. Teams such as Manchester City and Liverpool record every release point from the goalkeeper, then measure how quickly the ball advances past the first press. Studies compiled by Opta analysts reveal that teams averaging under 3.2 seconds from goalkeeper receipt to entry into the opposition half generate 1.4 more shots per game in build-up sequences. Observers note that these metrics feed directly into pre-match preparation, where coaches adjust pressing triggers based on the map data.
Build-Up Phase Adjustments in the 2025-26 Season
During the opening months of the 2025-26 campaign, several clubs refined goalkeeper positioning to exploit gaps exposed by distribution maps. Arsenal, for instance, positioned their goalkeeper wider on goal kicks to stretch opposition blocks, resulting in a 22 percent increase in completed passes into the final third compared with the prior season. Meanwhile Brighton used heat-map overlays to train their goalkeeper on underloaded zones, allowing center-backs to step higher without losing passing options. These adjustments coincide with league-wide trends that show build-up sequences now average 12.7 passes before a shot attempt, up from 9.4 passes recorded in 2022-23.
In-Play Goal Line Implications
Distribution maps influence goal-line decisions when goalkeepers choose between playing short or switching play under pressure. Figures released by the Premier League's official data partner indicate that goalkeepers who favor short distributions concede 0.8 fewer goals from counter-attacks per 90 minutes than those relying on longer clearances. In June 2026, clubs will review these patterns during pre-season camps, incorporating updated map layers that account for new offside rules and squad changes. Teams that align goalkeeper release angles with midfield pressing structures have recorded higher conversion rates on transitions that begin inside their own penalty area.
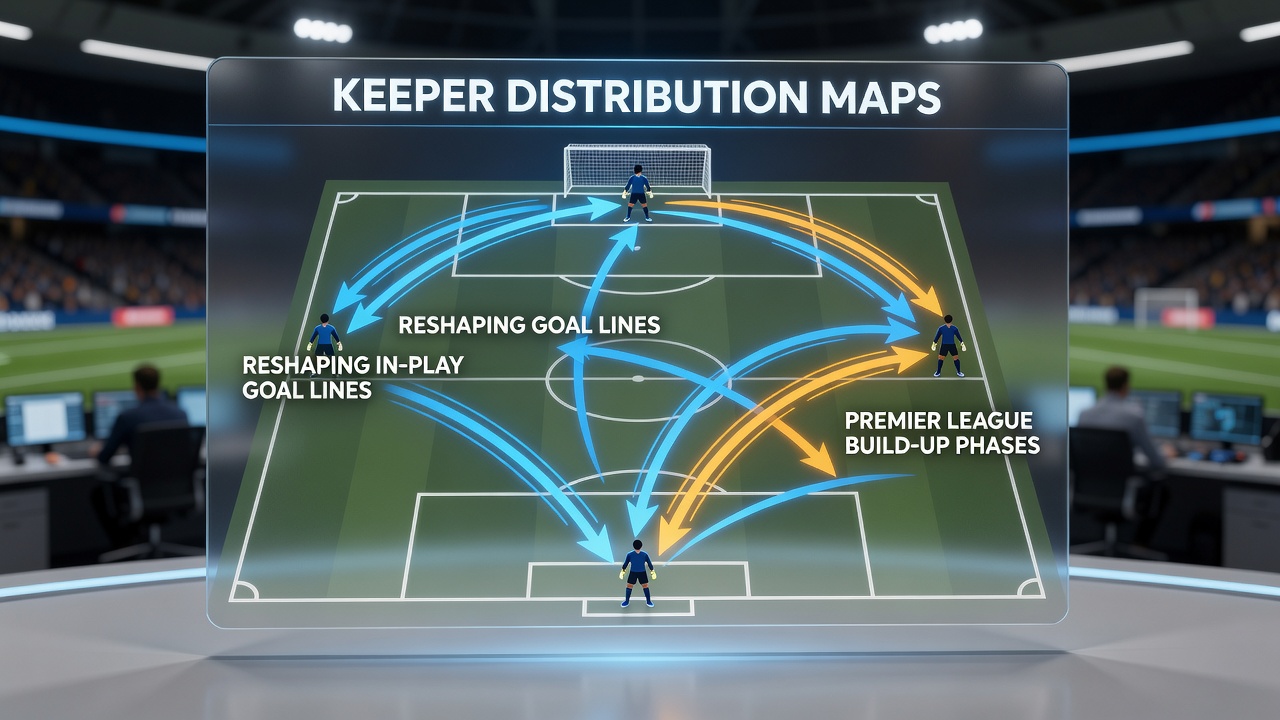
One study conducted by researchers at Loughborough University examined 420 Premier League matches and found that goalkeeper distribution choices directly correlate with defensive line height; sides maintaining a higher line completed 41 percent more short passes from the goalkeeper. The same report links these patterns to reduced long-ball reliance, which in turn lowers the frequency of second-ball duels in midfield. Coaches across the league now request real-time map updates during matches, allowing tactical tweaks at half-time that target specific zones where opponents leave space.
Case Examples from Recent Fixtures
Take the match between Aston Villa and Newcastle United in October 2025, where Villa's goalkeeper completed 47 short passes into central midfield, prompting Newcastle to drop their defensive line by an average of 4.2 meters. This adjustment opened channels for Villa's full-backs to receive the ball higher up the pitch. Similar patterns emerged in Chelsea's fixtures, where the goalkeeper's preference for left-sided distribution forced opponents to overload that flank, creating right-sided overloads for Chelsea attackers. Data providers tracking these shifts report that such in-game adjustments now occur in 63 percent of matches involving teams ranked in the top half of the table.
External sources such as the FIFA Technical Report Series have documented comparable trends across European leagues, noting that Premier League sides lead in the adoption of distribution mapping technology. Another analysis from the German Football Association highlights how Bundesliga clubs have begun importing these Premier League-derived methods, particularly for set-piece build-ups that start with the goalkeeper.
Technology and Data Integration
Clubs employ multiple layers of data to refine distribution maps, combining wearable tracking devices, video annotation, and AI-assisted pattern recognition. These systems generate heat zones that update after every match, allowing staff to compare current distributions against historical benchmarks. The Premier League's adoption of semi-automated offside technology in 2024 further refined these maps by providing precise spatial data on player positioning during build-up phases. Teams now cross-reference distribution success rates with expected goal values, identifying which passing angles deliver the highest returns.
What's interesting is how these maps interact with opponent scouting reports; analysts overlay rival pressing structures onto their own distribution templates to simulate different scenarios. This process has led to the development of contingency maps that goalkeepers review during warm-ups. In matches where one side trails, distribution patterns shift toward riskier longer passes, and data shows a 19 percent rise in such attempts after the 75th minute across the league.
Conclusion
Distribution maps continue to evolve as clubs collect more granular data on goalkeeper actions during build-up phases. The 2025-26 season has already demonstrated measurable impacts on defensive line positioning and transition efficiency, while preparations for June 2026 pre-season work will likely expand these tools to include opponent-specific simulations. As tracking technology advances, the relationship between goalkeeper distribution choices and in-play goal-line outcomes will remain a focal point for tactical departments across the Premier League.