Decoding Throw-In Battles That Tilt Premier League Points Spreads in Tight Contests
Written by Katja Peters · Jul 14, 2026
Decoding Throw-In Battles That Tilt Premier League Points Spreads in Tight Contests
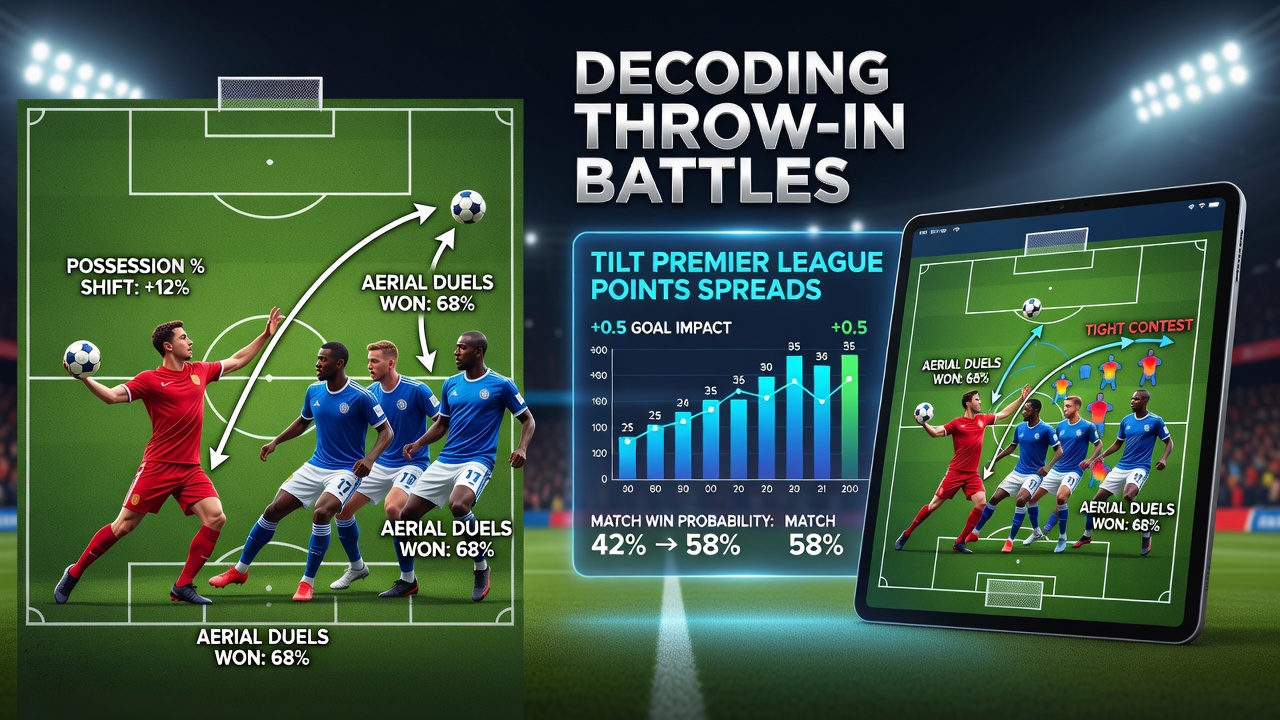
Throw-ins occur more than 40 times per Premier League match on average, according to Opta tracking data, and these restarts create measurable edges when teams execute them with precision in scorelines separated by a single goal. Analysts track how long throws, quick returns, and targeted deliveries into channels shift possession metrics and create goal-scoring opportunities that directly influence final points totals.
Measuring Throw-In Efficiency Across the League
Teams that retain possession from throw-ins at rates above 65 percent generate additional territorial advantages in the middle third, where data from the 2024-25 campaign shows a correlation with higher expected goal values. Full-backs and wingers often position themselves to receive short returns while central defenders step into space, turning routine restarts into structured build-up phases that wear down compact defensive blocks.
Long throw specialists remain a consistent feature because deliveries landing inside the penalty area produce header attempts at frequencies comparable to corner kicks in certain fixtures. Records indicate that clubs employing dedicated throw-in coaches achieve retention rates 8 to 12 percentage points higher than league averages during the closing stages of matches when fatigue reduces concentration levels.
Impact on Points Spreads in Low-Scoring Encounters
Matches finishing 1-0 or 1-1 account for roughly 28 percent of Premier League results each season, and throw-in sequences inside the final 15 minutes frequently decide whether an additional shot or clearance occurs. When trailing sides win more than 55 percent of their throw-ins in advanced areas, they record improved conversion rates into shots on target that can flip the result and alter the points distribution.
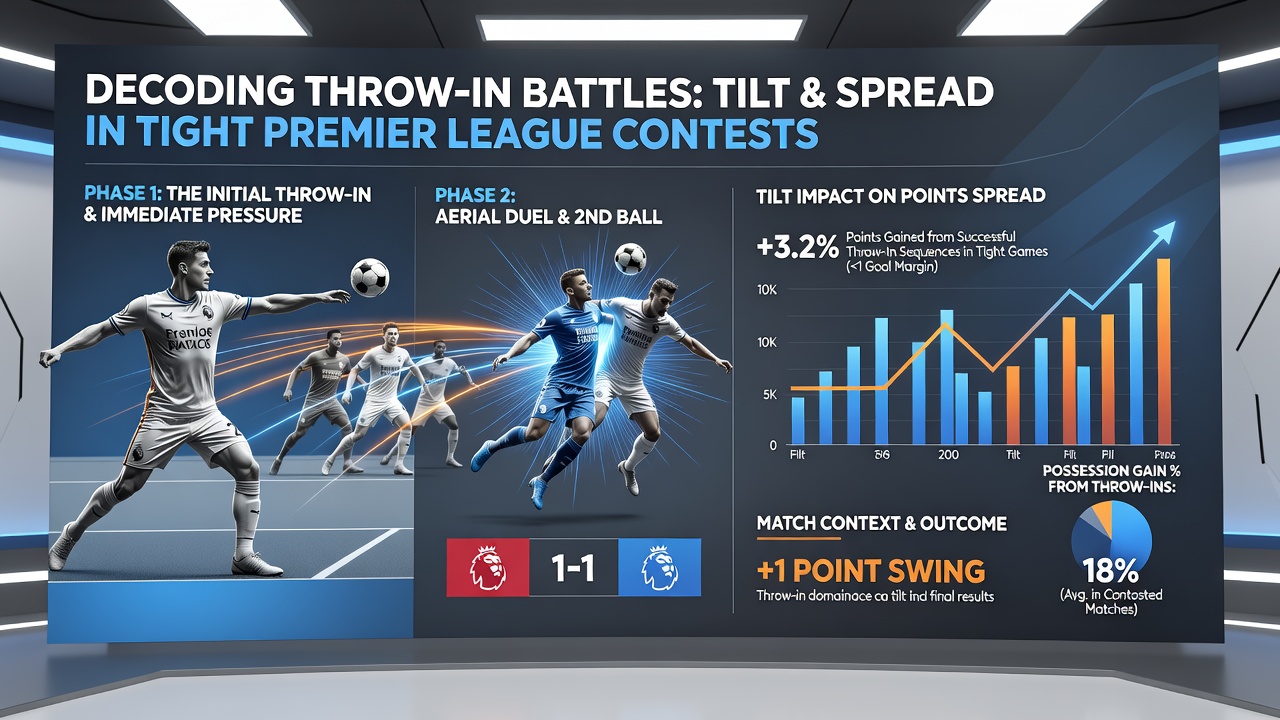
Statistical models developed by performance analysts separate throw-ins by zone and outcome, revealing that those taken between the halfway line and the attacking third produce the largest swing in expected points. One dataset compiled across five seasons demonstrates that teams converting at least three of every ten attacking throw-ins into shots record a 0.4 goal increase in average output per game compared with sides that lose possession immediately after the restart.
Strategic Patterns Observed in Recent Seasons
Coaches integrate throw-in routines into set-piece training because these restarts allow multiple players to occupy specific zones without offside restrictions. Quick short throws followed by immediate layoffs create overloads on the near side, while longer options target second-ball winners who have practiced aerial duels during midweek sessions.
Opposition scouting reports now include detailed throw-in maps that highlight which players take responsibility for different pitch regions. Midfielders positioned to intercept second balls after unsuccessful clearances contribute to counter-pressing triggers that turn defensive throw-ins into transition opportunities within seconds.
Role of Data Providers and Research Institutions
Performance departments rely on granular event data supplied by companies such as Stats Perform to quantify the value of each throw-in sequence. A collaborative report issued by researchers at the University of British Columbia examined set-piece efficiency across multiple European leagues and found that throw-in retention correlates positively with overall points accumulation when controlling for squad quality and schedule density.
These findings align with league-wide observations that sides finishing in the upper half of the table consistently post higher throw-in success percentages inside their own half, reducing the number of cheap turnovers that allow opponents to build sustained pressure.
Conclusion
Throw-in execution continues to function as an under-appreciated lever in Premier League contests decided by narrow margins. Retention rates, delivery accuracy, and second-ball winning percentages translate into measurable shifts in expected goals and points totals when matches remain level or separated by one strike. Clubs that refine these restarts through specialized coaching and data analysis maintain a repeatable advantage that compounds across a 38-game schedule.