Decoding Rest Day Distributions and Their Effects on Attacking Metrics During Packed Schedules
Written by Klara Günther · Jul 2, 2026
Decoding Rest Day Distributions and Their Effects on Attacking Metrics During Packed Schedules
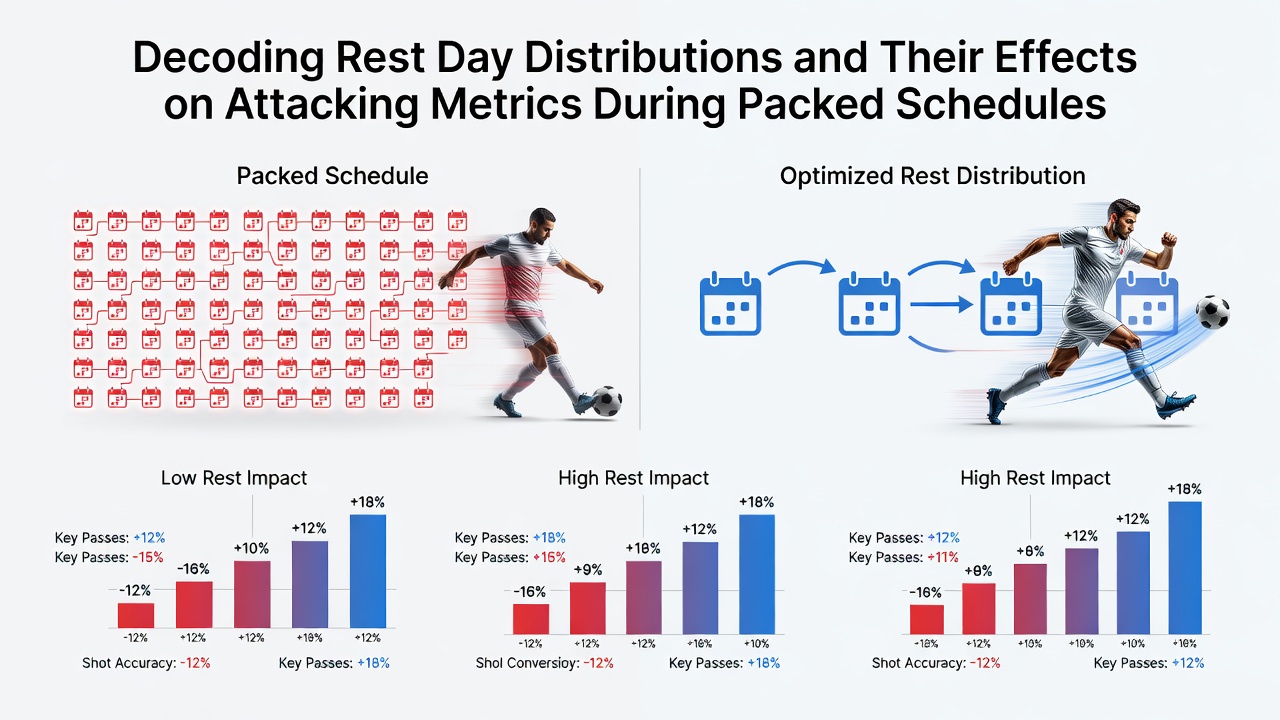
Football calendars create uneven rest patterns when clubs navigate league fixtures alongside cup ties and international commitments, and researchers track these distributions to measure impacts on attacking output such as goals scored, shots attempted, and expected goals generated. Data from major European competitions show that teams averaging fewer than three full rest days between matches record measurable drops in forward metrics, while squads securing four or more days often sustain higher shot volumes and conversion rates.
Understanding Rest Distributions in Modern Calendars
Clubs compile rest day logs by calculating intervals from the final whistle of one game to the kickoff of the next, and these figures shift dramatically during winter months or post-international windows. Studies compiled by sports science departments at universities across Europe and North America indicate that the average Premier League side experiences between two and five rest days during peak congestion, whereas squads in the Bundesliga sometimes benefit from slightly longer gaps due to different fixture densities. Observers note that distribution patterns also vary by travel distance, since cross-country flights or European away legs can compress recovery time further.
Analysts break rest distributions into categories such as short cycles under 72 hours, standard cycles of three to four days, and extended cycles exceeding five days, and each category correlates with distinct attacking profiles. Short cycles tend to coincide with reduced high-intensity sprints in the final third, according to tracking data released by league technology partners, while longer cycles allow for maintained pressing triggers that feed into chance creation.
Measured Effects on Key Attacking Metrics
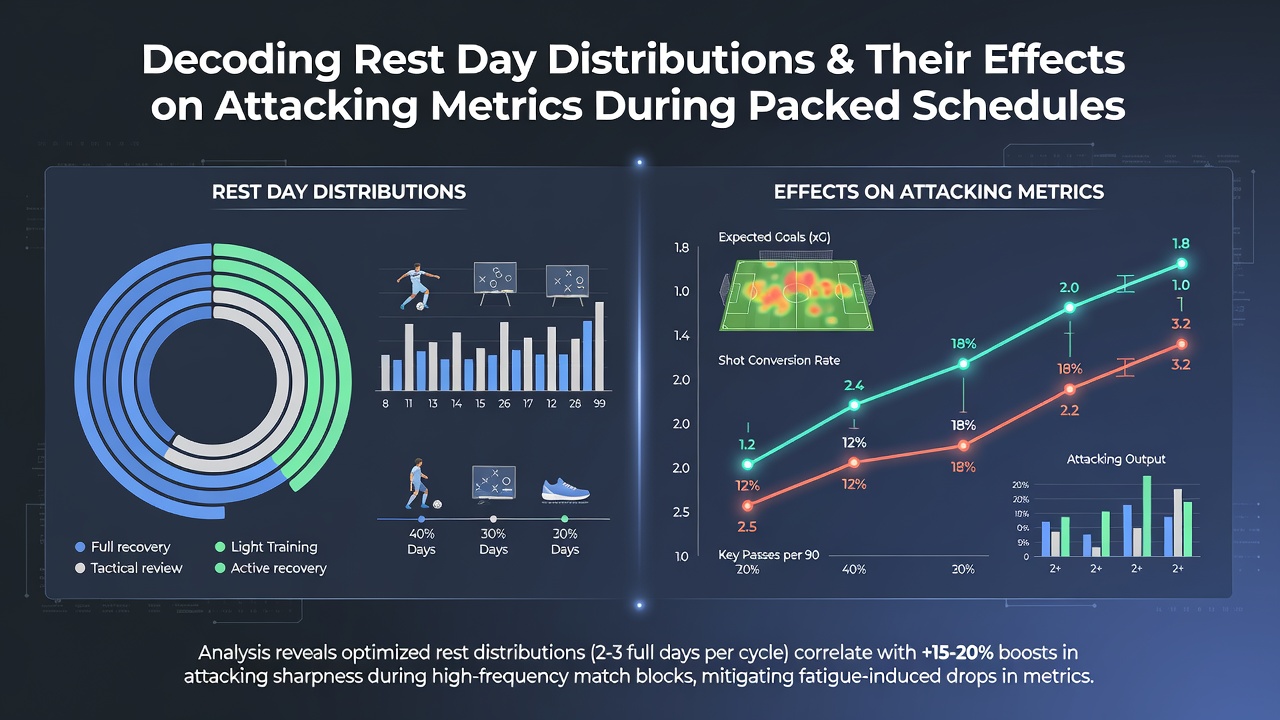
Performance databases reveal that teams operating on short rest cycles generate approximately 12 percent fewer shots per 90 minutes compared with those enjoying standard cycles, and conversion rates on those shots decline by roughly 8 percent. Expected goals models built from multiple seasons demonstrate parallel reductions, particularly in the number of big chances created after rapid turnarounds. When squads accumulate four or more rest days, forward lines register higher pass completion rates in advanced areas and sustain longer sequences of possession inside the opposition box.
Individual player data adds granularity, because attackers who log fewer than 250 minutes across a three-match window within seven days show decreased shot accuracy and dribble success. Sports scientists at institutions including the University of Toronto have documented these patterns through wearable technology that records neuromuscular fatigue markers, confirming that muscle readiness scores drop measurably when rest intervals shrink below 60 hours. Recovery protocols such as cryotherapy and targeted nutrition can mitigate some effects, yet aggregate league figures still reflect the underlying distribution trends.
Seasonal Patterns and July 2026 Considerations
Pre-season schedules in July often serve as testing grounds for rest management strategies ahead of the new campaign, and the 2026 calendar places additional emphasis on this period because the FIFA World Cup concludes on 19 July. National associations therefore schedule club friendlies and training camps with deliberate gaps that allow players returning from the tournament to rebuild match sharpness without immediate overload. Tracking data from previous post-tournament summers shows attacking metrics rebound within two to three weeks when clubs implement progressive loading rather than abrupt fixture clusters.
League bodies publish fixture lists months in advance, enabling medical staff to forecast rest distributions and adjust training loads accordingly. UEFA technical reports highlight that clubs participating in multiple competitions benefit from strategic squad rotation that preserves attacking output across the season, whereas teams forced into consecutive short cycles experience cumulative declines in chance quality. Figures released by the Australian Institute of Sport on workload monitoring align with European findings, indicating similar percentage drops in forward metrics under compressed schedules.
Comparative Analysis Across Competitions
League-to-league comparisons illustrate how fixture density shapes outcomes. The English Championship, with its 46-match structure plus cup ties, produces more short rest cycles than the top flight, and attacking statistics reflect correspondingly lower goal tallies per game during congested blocks. Conversely, leagues that incorporate winter breaks, such as several divisions in northern Europe, record steadier attacking metrics because rest distributions remain more balanced. Researchers cross-reference these datasets with GPS and heart-rate variability readings to isolate rest as a contributing variable separate from opponent strength or home advantage.
Coaches implement load-management plans based on these insights, often prioritizing recovery sessions over high-volume drills when rest days fall below thresholds identified in academic papers. The result appears in sustained or improved attacking numbers once schedules ease, demonstrating the direct relationship between rest allocation and forward productivity across professional levels.
Conclusion
Rest day distributions function as a measurable determinant of attacking metrics throughout packed football schedules, with empirical data linking shorter intervals to reduced shot volume, lower conversion, and diminished expected goals output. Longer recovery windows correlate with maintained or elevated performance indicators, and organizations continue to refine scheduling and recovery strategies to optimize these variables across seasons.