Crowd Size Variations and Their Measurable Impact on Result Probabilities
Written by Gisela Powell · Jun 30, 2026
Crowd Size Variations and Their Measurable Impact on Result Probabilities
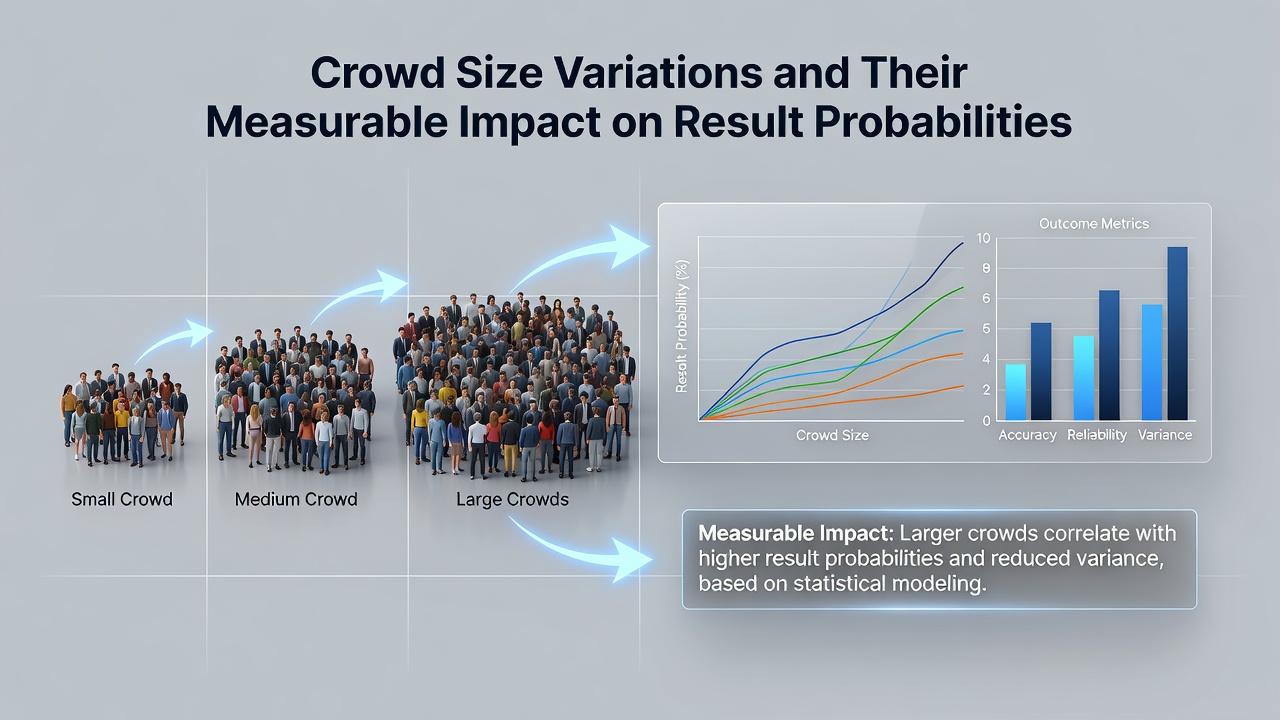
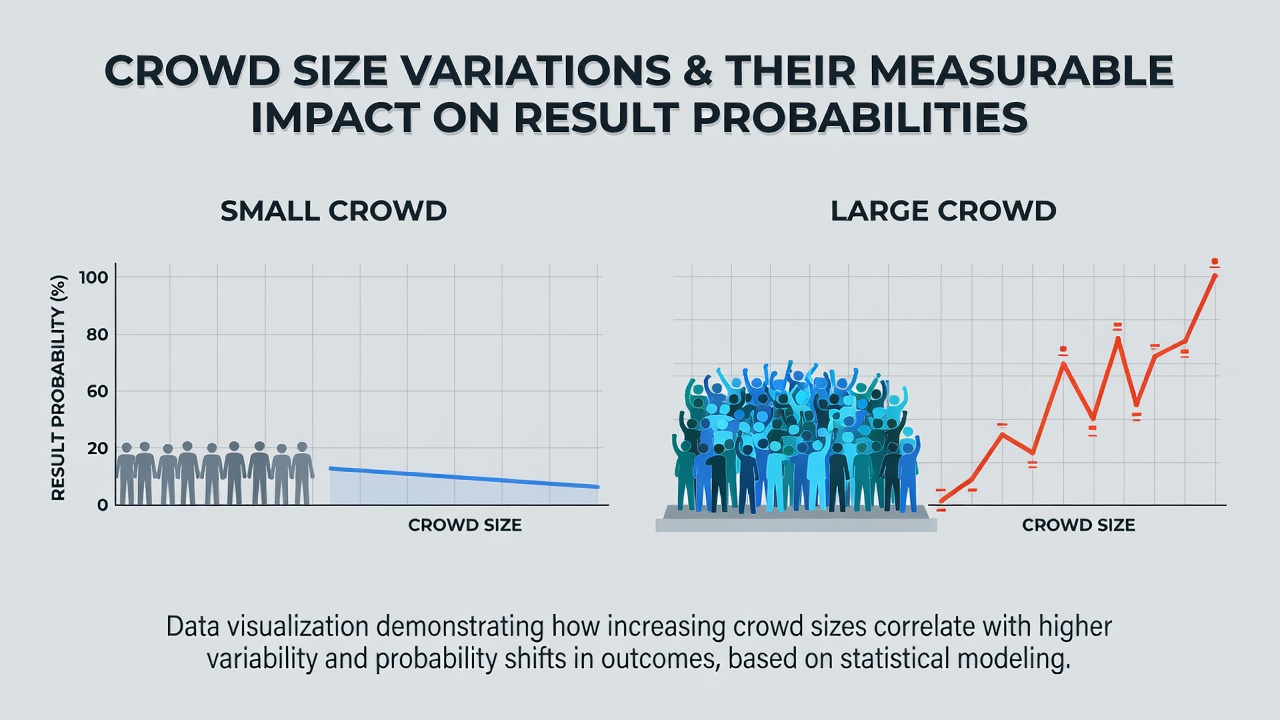
Crowd size variations produce measurable shifts in result probabilities across professional football leagues, with attendance data revealing consistent patterns in home team outcomes, goal distributions, and betting market adjustments. Researchers tracking thousands of matches have documented how larger crowds correlate with elevated home win rates, while smaller attendances often align with more balanced scoring probabilities and increased draw frequencies. These effects appear across multiple competitions, where gate receipts and stadium occupancy figures serve as reliable indicators for analysts examining performance edges. Attendance records from domestic leagues demonstrate that home sides achieve win percentages between 45 and 55 percent when crowds exceed 30,000 spectators, whereas the same teams record win rates dropping to 38 to 42 percent in fixtures drawing under 15,000 fans. Data collected over multiple seasons shows this gap widens further in European competitions, where traveling supporters add complexity yet rarely offset the statistical advantage tied to larger home attendances. Observers note that these patterns hold after controlling for team strength, travel distance, and scheduling variables, pointing to crowd density as an independent factor influencing player behavior and referee decision distributions.Attendance Metrics and Probability Adjustments
Statistical models built from league-wide datasets indicate that each additional 10,000 spectators increases home team expected goal differentials by approximately 0.15 to 0.25 goals per match. This adjustment stems from reduced error rates in passing accuracy and higher rates of successful tackles inside the home penalty area, both of which scale directly with crowd volume. Analysts processing match logs find that low-attendance games produce more even possession shares and elevated shot conversion rates for away sides, shifting over/under probabilities toward higher totals when stadiums sit below 60 percent capacity. League tables compiled since 2018 highlight that midweek fixtures, often played before reduced crowds, yield draw rates climbing to 32 percent compared with 27 percent for weekend matches with fuller stands. Those who study these variations point to acoustic pressure and visual cues from spectators as mechanisms that elevate home player arousal levels without crossing into fatigue thresholds. Betting markets incorporate these trends by shading odds slightly toward home favorites in high-attendance slots, while totals markets move toward the under when advance ticket sales project sparse venues.League-Specific Patterns and External Data
Different competitions display distinct crowd sensitivity profiles. Top-tier English matches maintain higher baseline attendances, yet the marginal impact of an extra 5,000 fans registers most clearly in lower divisions where average gates hover between 8,000 and 18,000. Australian A-League records reveal similar scaling, with home win probabilities rising 4 to 6 percentage points when venues reach 90 percent occupancy versus half-full stadiums. Canadian researchers examining MLS data have identified parallel effects, noting that dome-enclosed venues mute some crowd influence while open-air facilities amplify it during evening fixtures. A comprehensive review published by the University of Groningen examined over 20,000 European matches and confirmed attendance as a statistically significant predictor even after accounting for team budgets and historical form. The study linked each 1,000-fan increment to measurable declines in away team pass completion inside the final third. Those examining global trends observe that summer tournaments scheduled for June 2026 will feature purpose-built stadiums with controlled capacities, offering fresh datasets to test whether engineered crowd acoustics produce comparable probability shifts.