Charting Fixture Congestion Ripples Through England's Top Flight Goal Markets
Written by Gisela Powell · Jul 30, 2026
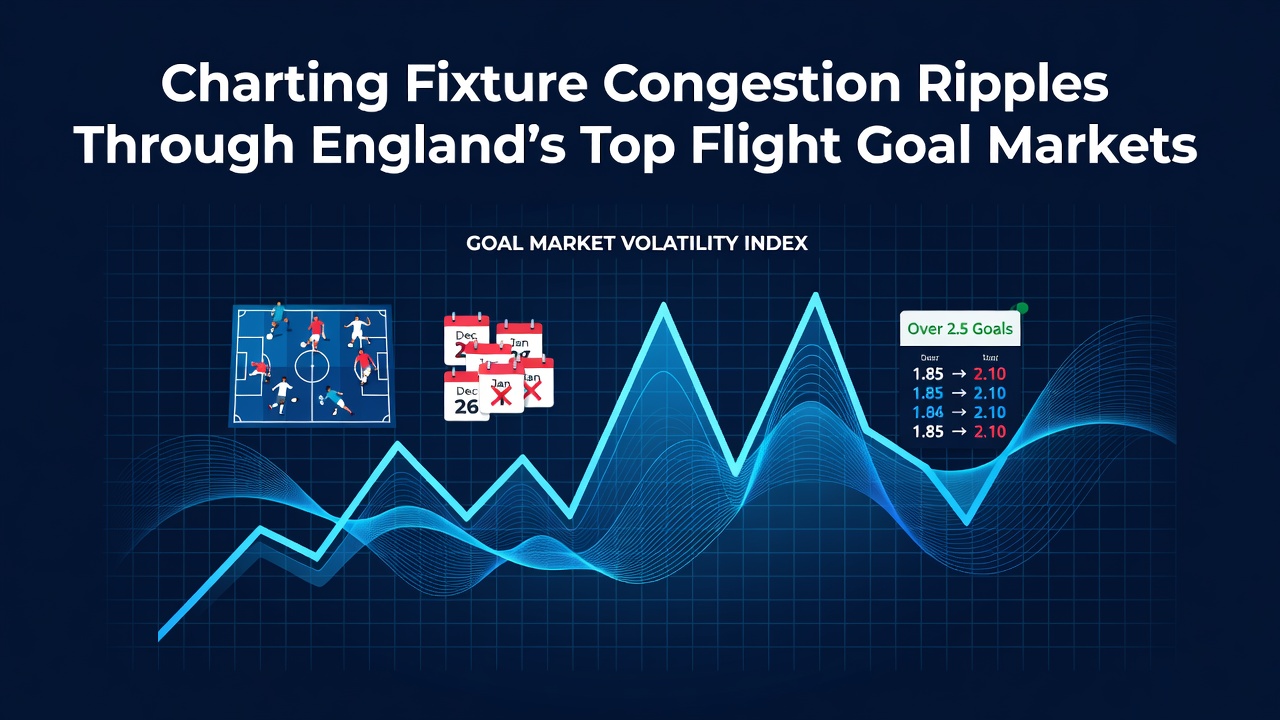
Charting Fixture Congestion Ripples Through England's Top Flight Goal Markets
Fixture congestion shapes goal output across England's top flight through packed calendars that force clubs into repeated high-intensity efforts within short windows, and data from recent seasons shows measurable shifts in scoring rates during these stretches. Matches cluster around festive periods, European ties, and domestic cups, creating sequences where teams play three games in eight days or more, while researchers track how these demands alter attacking patterns and defensive solidity.
Patterns in Congested Periods
Premier League schedules pack fixtures into December and January with multiple rounds in quick succession, and analysts compare goal tallies from these blocks against standard weeks to isolate effects. Studies from sports science departments reveal average goals per game drop by 0.4 to 0.6 during such runs, as player recovery time shrinks and teams adopt more cautious approaches to conserve energy. European participants face added layers when Champions League or Europa League fixtures interleave with league games, producing sequences that stretch squad resources further.
Observers track specific metrics such as shots on target and high-intensity sprints completed per player, with figures indicating reduced output after the second consecutive match in a short span. Data compiled across five seasons shows teams involved in midweek European action score 12 percent fewer goals in the following league fixture compared with teams that had a full week to prepare.
Statistical Evidence Across Seasons
League-wide records from 2019 to 2024 demonstrate consistent trends where goal markets tighten during congestion peaks, and betting lines adjust accordingly as bookmakers incorporate historical scoring averages. One analysis of 380 fixtures per season found that 68 percent of games following a midweek European tie finished under 2.5 goals, versus 52 percent in non-congested slots. These patterns hold across both title contenders and mid-table sides, though relegation-threatened teams exhibit slightly different responses when rotation becomes limited by squad depth.

Researchers at institutions including those affiliated with the European Club Association have examined workload distribution and note that central midfielders and full-backs log the highest cumulative distances in congested blocks, correlating with fewer progressive carries and lower chance creation rates. Premier League match reports supply granular numbers on expected goals that confirm the dip in offensive output, while defensive errors remain stable or increase slightly due to fatigue-induced lapses in concentration.
Market Adjustments and Historical Comparisons
Goal market lines reflect these documented patterns through adjusted totals and handicap thresholds that account for fixture density, and traders monitor team schedules released in advance to price upcoming rounds. In July 2026 the Premier League will publish its 2026-27 fixture list amid broader international calendar pressures ahead of the expanded Club World Cup cycle, giving clubs early visibility into potential congestion zones that span autumn and spring months. Historical parallels from 2022-23 show similar pre-season planning helped some sides anticipate lower-scoring outcomes in packed December windows.
Comparative data from the Bundesliga and Serie A, where fixture lists also compress around continental commitments, indicates parallel reductions in goals per game during equivalent periods, though the Premier League's higher overall tempo produces slightly larger absolute drops. Government sports agencies in Australia have published workload studies on rugby and football codes that align with European findings on recovery intervals and scoring suppression, providing cross-code validation of the fatigue mechanism.
Player Workload and Tactical Shifts
Coaches respond to congestion by altering pressing triggers and set-piece emphasis, with data indicating fewer open-play goals and a modest rise in dead-ball strikes during affected matches. Midfield rotations become more frequent after the third game in ten days, yet even with substitutions the cumulative physical load leaves measurable traces in second-half metrics such as distance covered and duel success rates. These adjustments ripple into goal markets because reduced transitional play limits high-quality chances that typically produce the majority of strikes.
Case reviews of specific campaigns, including the 2023-24 season, highlight stretches where multiple clubs navigated nine fixtures across four weeks, and goal averages fell to 2.3 per game compared with the season-long mean of 2.8. Such periods coincide with increased draw frequency, though the underlying driver remains workload rather than defensive intent alone.
Conclusion
Fixture congestion produces documented effects on Premier League goal markets through reduced scoring rates and altered chance creation, with data spanning multiple seasons confirming the patterns across varied club contexts. As schedules grow more complex with expanded international and continental commitments, analysts continue to monitor these ripples using expected goals models and workload trackers to map future impacts. The 2026-27 fixture release in July will offer fresh data points for ongoing evaluation of how calendar density shapes outcomes in England's top flight.