Aerial Duel Metrics and Their Role in Forecasting Defensive Resilience Across English Top Division Fixtures
Written by Eden Beck · Jun 4, 2026
Aerial Duel Metrics and Their Role in Forecasting Defensive Resilience Across English Top Division Fixtures
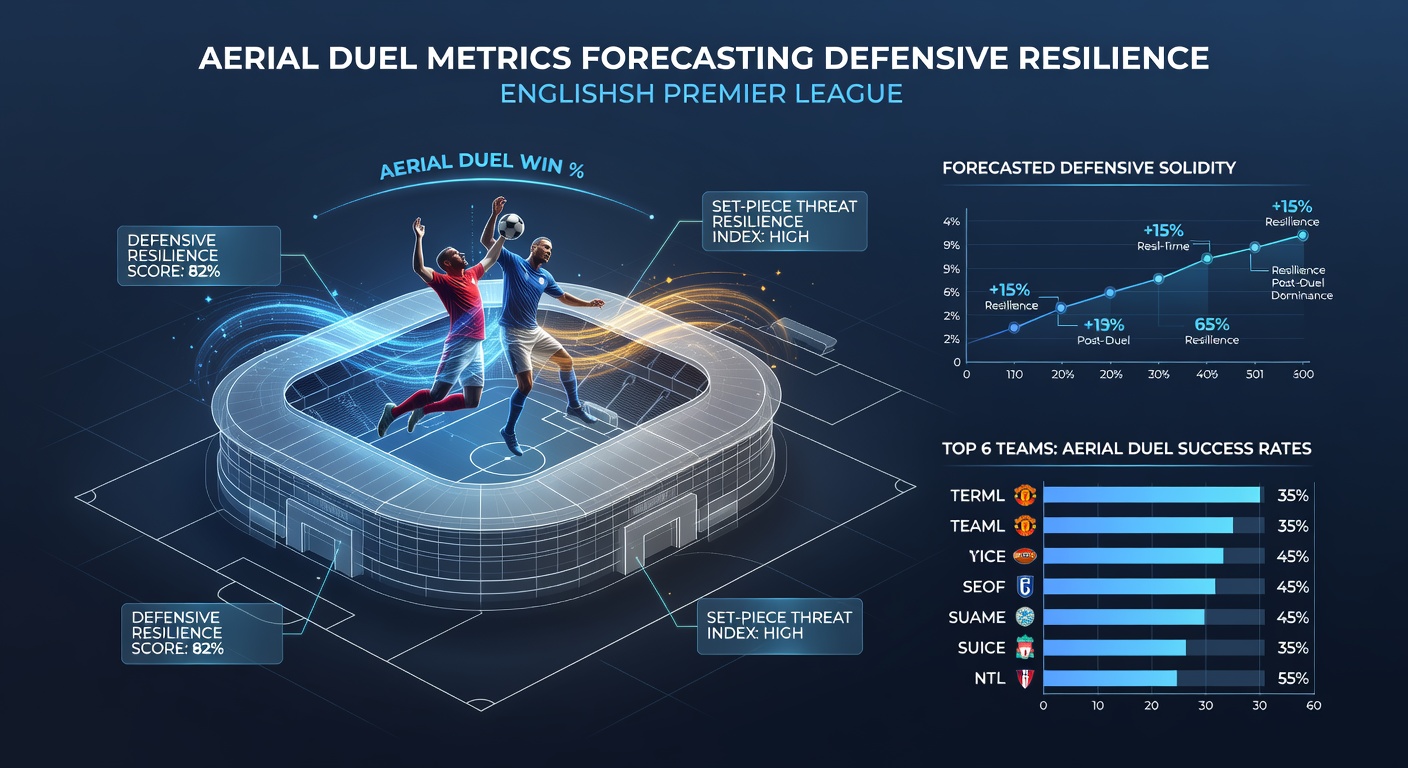
English top division matches often hinge on battles in the air, where teams that dominate aerial duels tend to build stronger defensive structures overall. Analysts track these contests through metrics such as aerial duel success rate, duels won per ninety minutes, and the percentage of clearances completed under pressure, all of which feed into models that project how well a side holds firm against crosses and set-piece threats.
Defining Aerial Duel Metrics in Modern Analysis
Opta and similar data providers record every contested header as an aerial duel, separating wins from losses while noting the location on the pitch and the players involved. Central defenders who post success rates above sixty-five percent per match frequently anchor backlines that concede fewer goals from open play, according to aggregated figures from multiple seasons. Midfielders contribute through second-ball recoveries, and full-backs add value when they step up to contest wide deliveries.
These numbers gain extra weight because they reveal patterns that raw possession or tackle counts often miss. A team might control the ball yet struggle when the opponent switches to long balls or diagonal switches, exposing gaps that only aerial data highlights.
Linking Aerial Strength to Defensive Outcomes
Research from European football analytics groups shows that squads finishing in the top half of the table average 52 percent aerial duel wins across a campaign, whereas lower-placed sides sit closer to 46 percent. The difference appears most clearly in matches against teams that rely on target forwards or tall wingers who thrive on flick-ons and knockdowns.
Defensive resilience shows up in reduced expected goals against from crosses, fewer shots from the six-yard box, and improved clean-sheet rates in away fixtures where space opens up for aerial challenges. Data sets covering the past decade indicate that a five-percentage-point improvement in aerial duel success correlates with roughly 0.3 fewer goals conceded per game on average.
Forecasting Applications Across the Fixture Calendar
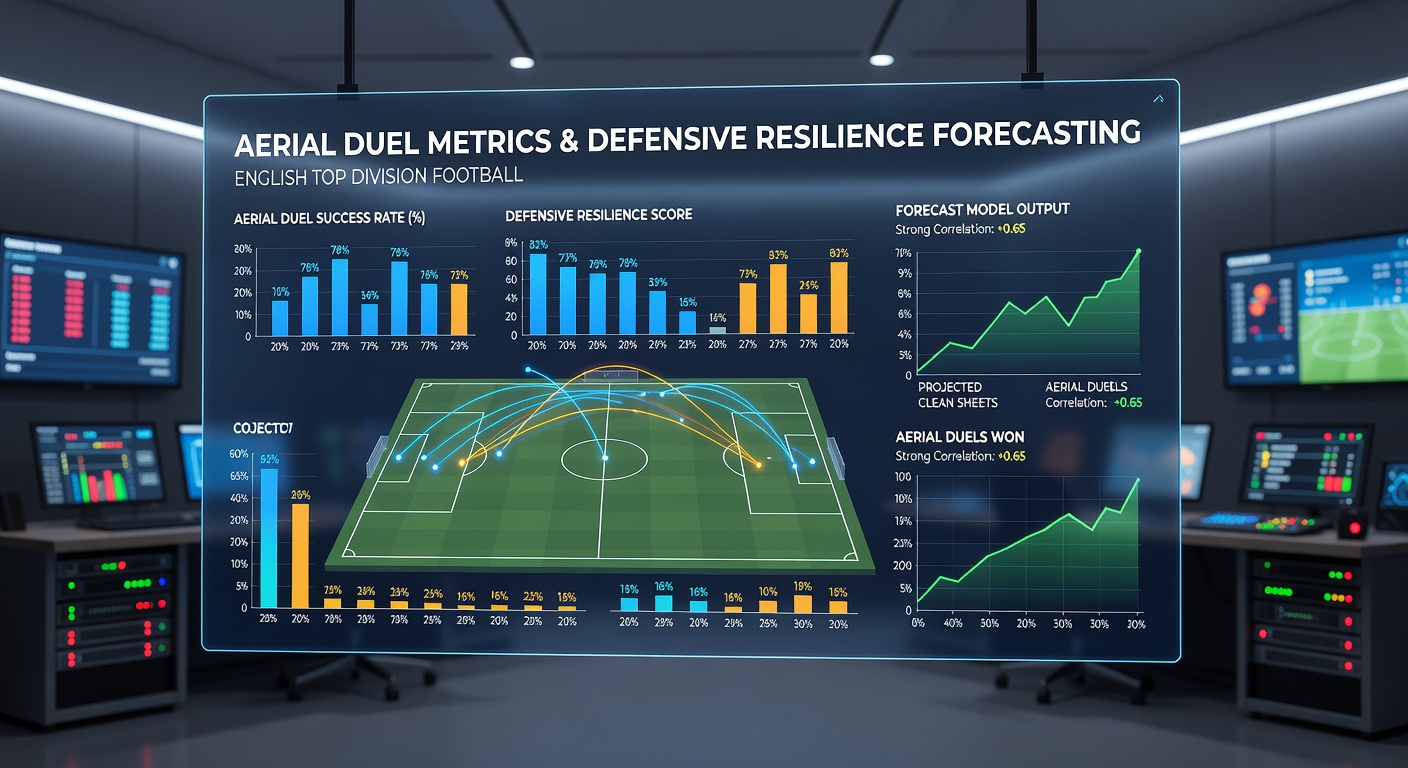
Betting models and scouting departments now integrate aerial duel trends into pre-match projections, especially when one side faces an opponent with a high volume of set-piece attempts. Teams that maintain strong aerial numbers through the winter schedule often carry that edge into spring fixtures, where fatigue can reduce jumping ability and timing.
By June 2026, updated tracking systems from league partners will include more granular data on duel height, player fatigue markers, and pitch conditions, allowing forecasters to adjust resilience predictions with greater precision. Clubs already use these insights during recruitment windows to identify defenders whose profiles match the demands of specific opponents.
Position-Specific Contributions and Team Patterns
Central defenders account for the largest share of aerial duels in most lineups, yet full-backs who excel in this area help limit wide overloads that stretch defensive shapes. Goalkeepers who claim crosses at high rates reduce the need for outfield players to contest every ball, preserving energy for transitions.
Observers note that certain managers build squads around multiple aerial specialists, creating depth that maintains duel win percentages even when rotation occurs. This approach proves particularly useful during congested periods when injuries or suspensions force changes in the back line.
Case Examples from Recent Campaigns
One club that improved its aerial duel success from 48 to 57 percent over two seasons recorded a 22 percent drop in goals conceded from crosses, illustrating how targeted training and personnel adjustments translate into measurable defensive gains. Another side that relied heavily on a single dominant centre-back saw its numbers dip sharply after that player departed, exposing vulnerabilities that opponents exploited through direct play.
These shifts appear consistently across home and away contexts, though the gap narrows slightly in matches played on wider pitches where teams have more room to bypass aerial battles altogether.
Integration with Broader Performance Data
Aerial metrics combine effectively with other indicators such as pass completion under pressure and recovery times after lost duels. When a side wins the first ball yet fails to clear the second phase, the initial aerial success provides limited defensive value. Analysts therefore weight duel outcomes by what follows, creating composite scores that better forecast resilience over ninety minutes.
Academic work from institutions outside the UK, including studies published by Canadian sports science departments, supports the view that aerial dominance reduces variance in defensive performance, making outcomes more predictable when teams face similar styles of attack.
Conclusion
Aerial duel metrics supply a focused lens for evaluating defensive resilience in English top division fixtures. They highlight player contributions that standard box-score stats overlook, reveal patterns that hold across multiple seasons, and support more accurate forecasting when combined with contextual factors such as opponent style and fixture congestion. As tracking technology advances, these numbers will continue to refine how analysts and teams anticipate outcomes in matches where the ball spends significant time in the air.